software

Viewing posts tagged software

LipidGenie, a genome-guided lipid identification tool

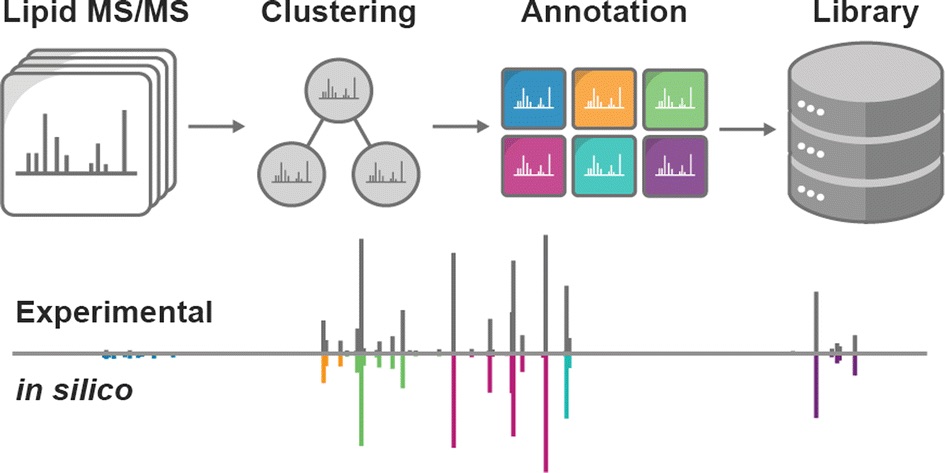
Despite the crucial roles of lipids in metabolism, we are still in the early stages of annotating lipid species and their genetic basis. To help in this work, a team of researchers led by Vanessa Linke recently developed LipidGenie, an interactive, query-able resource for lipid identification. The research team used high-resolution liquid chromatography–tandem mass spectrometry to quantify 3,283 molecular features from the liver and plasma of outbred mice. These features were then mapped to 5,622 lipid quantitative trait loci, compiled and cross-referenced to the human genome.

Download the software and read the manuscript.

Argonaut enables collaborative data visualization and exploration

Argonaut is an online platform for collaborative exploration of multi-omic data described in this recent publication by Brademan et al.

Through this platform, information is presented using intuitive, interactive visualizations in a code-free environment, empowering both experts and non-experts worldwide to easily interact and share data.

The Argonaut platform aims to overcome the hurdles of working with large datasets and lower the barrier to entry for biological and clinical collaborators.

This and other software tools can be found here.

MS-Helios for Compact Data Visualization of Multi-omic Datasets

MS-Helios is an easy-to-use command line tool which works to solve the challenge of data analysis and visualization in the face of high-resolution mass spectrometery.

Though high-resolution mass spectrometry can identify hundreds of metabolites and thousands of proteins, this can make data analysis and visualization hard to do.

MS-Helios is a solution, allowing for compact data representation and reduced dimensionality. This tool also allows non-experts and experts alike to generate data and configuration files and publish high-quality, circular plots with Circos.

This software is available for download here.
The manuscript for MS-Helios can be viewed here.

Software Highlight: LipiDex

LipiDex is a free and open-source software package offered by NCQBCS. This software package unifies all stages of the LC-MS/MS lipid identification process, and also utilizes intelligent data filtering to reduce manual result curation while increasing identification confidence.

One can use LipiDex to accomplish a variety of functions. For instance, one can create and manage custom in-silico lipid spectral libraries; model complex lipid MS/MS fragmentation using intuitive fragmentation templates; generate high-confidence MS/MS lipid identifications; annotate chromatographic peak tables with lipid identifications; and automatically filter peak tables for adduct peaks, in-source fragments and dimers.

Information on both LipiDex and Library Forge can be found here, and the software download is located here. Additionally, information on other software that the National Center for Quantitative Biology of Complex Systems offers can be found here.

Graphical Abstract depicting the software package lipidex accomplishing a variety of functions, such as the modeling of complex lipid ms/ms fragmentation, generation of high-confidence ms/ms lipid identifications, annotation of chromatographic peak tables, and the creation of in-silico lipid spectral libraries.

Software Highlight: Morpheus

Morpheus, a custom search algorithm designed specifically for high-resolution tandem mass spectra, is one of many free softwares offered by NCQBCS.

Developed by the Coon Lab, Morpheus works specifically with high-mass accuracy data, and is superior to other similar programs, such as those originally designed for low-resolution MS/MS. For instance, compared to Mascot, Open Mass Spectrometry Search Algorithm (OMSSA) and Sequest, Morpheus can identify more spectra, peptides and proteins at a 1% false discovery rate. Morpheus is also 1.5-4.6 times faster than OMSSA.

Morpheus is free and open source under a permissive license.

The manuscript for Morpheus is available here, and the software can be downloaded here. Additionally, information on other software that the National Center for Quantitative Biology of Complex Systems offers can be found here.

Graphical abstract for the Morpheus manual, demonstrating the algorithm's matching capabilities 
Morpheus score =10.302, 10 matching products +30.2% matching abundance.

Metandem, a free and online software for MS-based isobaric labeling metabolomics

Hao et al. (2019) recently published a paper in Analytica Chimica Acta detailing the utility of Metandem, a data analysis software which is aids in isobaric labeling-based metabolomics.

While mass spectrometry-based stable isotope labeling is advantageous compared to other methods of isotope labeling due to its multiplexing and accurate quantification capabilities, its data analysis requires specifically customized bioinformatic tools. However, Metandem, a free, unique and online software, can aid in the analysis of stable isotope labeling-based metabolomics data.

Metandem has a number of different features that assist in MS-based isobaric labeling, such as integrating feature extraction, metabolite quantification and identification, batch processing of multiple data files, online parameter optimization for custom datasets, data normalization and statistical analysis.

Metatandem is available free and online at http://metandem.com/web/

Graphical abstract for Metandem paper published by Hao et al in Analtica Chimica Acta demonstrating the software's utility in  isobaric labeling, integrating feature extraction, and metabolite quantification.

Software Highlight: Compass

The Coon OMSSA Proteomic Analysis Software Suite, or COMPASS, is one of many custom software and web-based data tools that NCQBCS offers in an effort to extend its expertise to the broader scientific community.

Compass is a free and open-source software pipeline designed around the Open Mass Spectrometry Search Algorithm. Compass aids in high-throughput analysis of proteomics data such as FASTA database creation, peptide-spectral matching, calculation of false discovery rates, and protein grouping, as well as spectral reduction, peptide quantitation via isobaric labeling (or without), and protein parsimony.

Furthermore Compass utilizes graphical user interfaces which work well with data files in original instrument vendor format, making it easy to use.

The manuscript for Compass is available here, and the software can be downloaded here. Additionally, information on other software that the National Center for Quantitative Biology of Complex Systems offers can be found here.

Graphical abstract from the COMPASS manual, demonstrating its uses as a database maker, dta generator, fdr optimizer, and protein herder.

Brademan Paper on the Interactive Peptide Spectral Annotator

Brademan et al unveiled the Interactive Peptide Spectral Annotator (IPSA), in a recent issue of Molecular and Cellular Proteomics.

The IPSA is an interactive and easily-accessible web-based annotator that can be used to conceptualize and characterize peptides with mass spectra. This tool, which can visualize peptides collected from different experimental and instrumental sources, has a variety of purposes including creating figures for publication, annotating spectra for negative-mode ionization and the like.

The IPSA can be accessed through this link:
http://www.interactivepeptidespectralannotator.com